This is a continuously variable proportional circle map. The map is of the known craters on the Earths surface. The size of the circles are proportional to the actual size of the craters.
A Univariate choropleth map is a choropleth map that only shows one variable. In this map it shows the percent of Pacific islanders living in Auckland, New Zealand.
A bivariate choropleth map is a variation of a normal choropleth map. It shows two different variables. In this map it shows the population and the median home value. It is interesting to see the home values in the more or less populated areas.
A DOQQ map is an aerial picture that is geometrically correct. The scale is correct and you can use the map to measure distance. in this map the scale is correct and would be a good map to use to see how far something's true distance is.
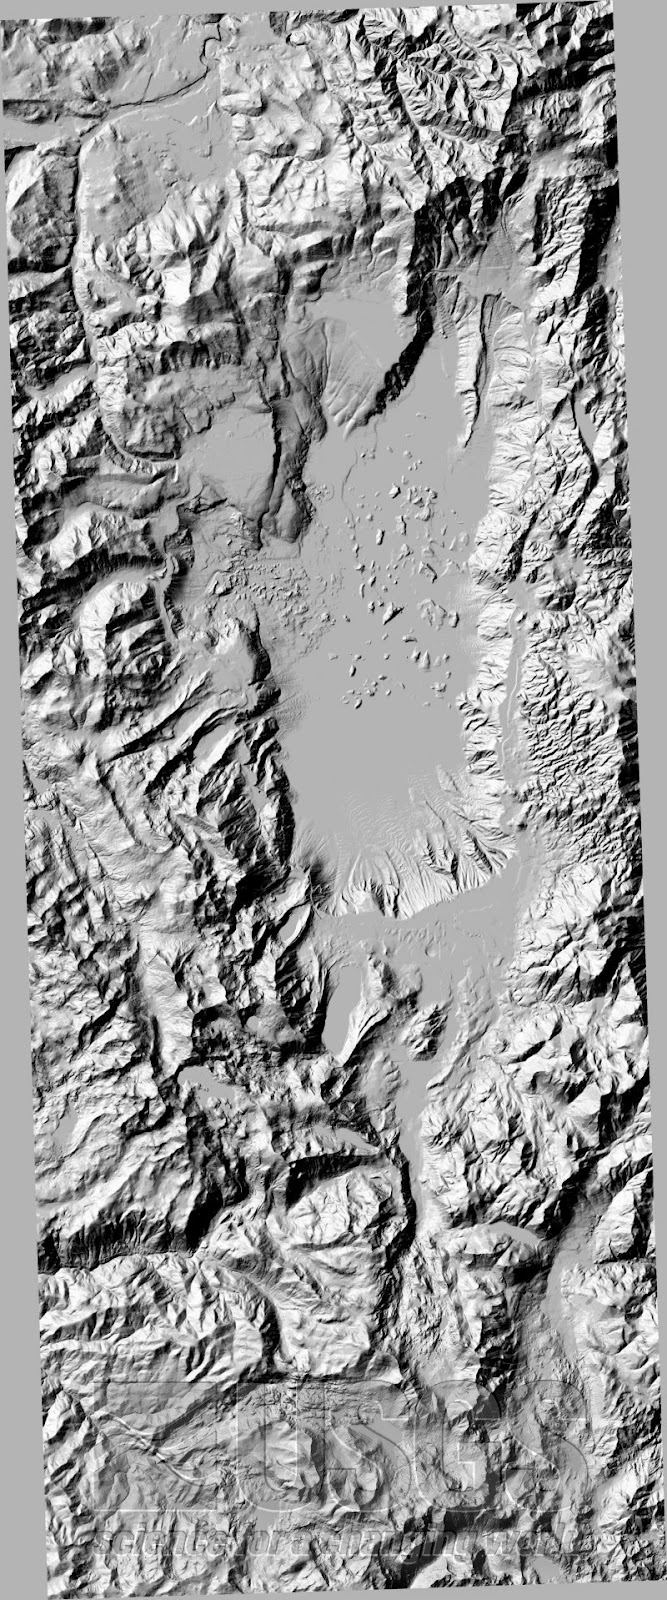
A DEM map is a map that shows a 3-D representation of the Earth's surface. This is a DEM map of Lake Tahoe from the USGS. You can see where the lake is in the the center and see the much taller mountains surrounding it.